What is virtual monitoring?
Virtual monitoring, virtual machine monitoring, or virtualization monitoring is the method in which software is used to monitor virtualized occurrences across a network. This can also be explained as having another smarter computing device residing within a computer to perform essential checks and balances on your system.
Virtual monitoring manages virtual machines by gathering data and continuously scrutinizing and recording the information gathered from the records that are generated by this process.
What are the benefits of virtual monitoring?
Virtual monitoring tools have many benefits, but the main reasons to go with this method is that it offers an efficient way to monitor and map virtual environments by using the best virtual tools available which can examine the big picture, as well as analyzing the tiny details of your IT environment using the fewest possible resources.
Some specific benefits include enabling IT teams to:
- Consolidate multiple virtual components into one interface;
- Monitor the resources utilization and performance from guests and hosts that include, but are not limited to CPU, memory, and more;
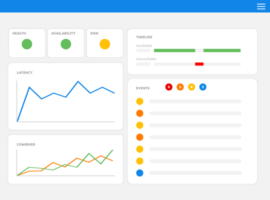
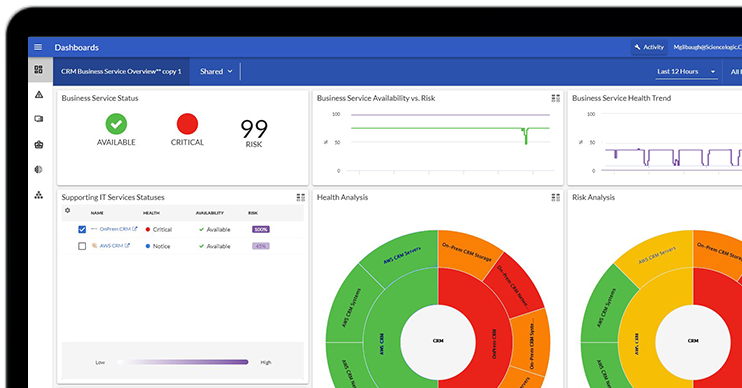
- Create custom dashboards that allow you to view and access your entire IT landscape;
- Track live migrations;
- Offer a robust and real-time system that will keep you abreast of all happenings on virtual machines across multiple metrics;
- Generate essential statistics by utilizing powerful analytical tools that will help optimize your system;
- Allow delete capabilities when something is not working;
- Get alerted through proactive techniques based on whichever criteria you wish to monitor; and
- Provide the ability to test diverse workloads in order to quickly adapt to your ever-changing needs.